import pandas as pd
import numpy as np
np.random.seed(12356)Random Forest - Classification
This notebook has two parts: Sample Codes and Practice.
1. Sample Codes
Installation: You will need to install python and jupyter. The easiest way is to install the package Anaconda as follows.
Download Anaconda from this link
Install Anaconda from the downloaded file
Open Jupyter Lab by
- Click to the Start Windows Logo and Type in Anconda Promp. Open Anaconda Promp
- In Anaconda Promp, type in:
jupyter laband hit Enter
- In Anaconda Promp, type in:
Data: The data should be in the same folder as the notebook.
A procedure of training and tuning predictive models runs as follows.
- Step 1: Import some packages
- Step 2: Import data and do some cleaning
- Step 3: Encode Categorical Variables, i.e. change a categorical variable to (multiple) numeric variables.
- Step 4: Split the data into training and testing
- Step 5: Train a first model
- Step 6: Test the model
- Step 7: Hyperparameters Tuning and redo Step 5 and 6
We will go over the above steps to train random forest with the titanic dataset. Notice that these codes can be reused for other dataset. The codes for Step 1, 4, 5, and 6 should be the same or at least similar when applied to other data. Only Step 2 and Step 3 will be different from data to data.
Step 1: Import some packages
Step 2: Import data and do some cleaning
# Import the data
df = pd.read_csv('titanic.csv')
# See all variables of the data
df.columnsIndex(['PassengerId', 'Survived', 'Pclass', 'Name', 'Sex', 'Age', 'SibSp',
'Parch', 'Ticket', 'Fare', 'Cabin', 'Embarked'],
dtype='object')# Assign input variables
X = df.loc[:,['Pclass','Sex','Age','Fare','Embarked','SibSp','Parch']]
# Assign target variable
y = df['Survived']
# Replace missing values by the median
X["Age"] = X["Age"].fillna(X["Age"].median())
# Impute the Embarked variable
X["Embarked"] = X["Embarked"].fillna("S")Step 3: Encode Categorical Variables
Encode a Categorical Variable = Turn it into multiple numeric variables
sklearn does not work directly with categorical variables. It requires the categorical variables to be encoded into numeric variables. There are multiple way to encode categorical variables. Here, we implement the simplest way of encoding: one-hot encoding or dummy encoding.
# Show the types of the variables
X.dtypes
Pclass int64
Sex object
Age float64
Fare float64
Embarked object
SibSp int64
Parch int64
dtype: object# Change Pclass to categorical variable
X['Pclass'] = X['Pclass'].astype(object)
# Encode categorical variable
X = pd.get_dummies(X)Step 4: Split the data into training and testing
test_size =.3 means 30% of the data is saved for testing.
from sklearn.model_selection import train_test_split

x_train,x_test,y_train,y_test=train_test_split(X,y,test_size=0.3)
Step 5: Train a model
n_estimators is the number of trees in the forest. max_features is the number of variables considered at each split.
from sklearn.ensemble import RandomForestClassifier
r1 = RandomForestClassifier(n_estimators=10, max_features=2)
r1.fit(x_train, y_train)
RandomForestClassifier(max_features=2, n_estimators=10)In a Jupyter environment, please rerun this cell to show the HTML representation or trust the notebook.
On GitHub, the HTML representation is unable to render, please try loading this page with nbviewer.org.
RandomForestClassifier(max_features=2, n_estimators=10)
Step 6: Test the model
# Accuracry on test data
r1.score(x_test, y_test)0.832089552238806Step 7: Hyperparameters Tuning and redo Step 5 and 6
How do we know the selection of the selected values of n_estimators and max_features above are the best selection? We actually do not know!
Tuning hyperparameters or Tuning a model is to search for the set of hyperparameters that works the best. To tune a model, one first needs to know what the hyperparameters/tuning parameters that the model has. A model may have several hyperparamters that sometime it is not practical to tune all the hyperparameters.
Our model here is random forest. To see the list of tuning parameters of random forest, one can check at the sklearn document of the model. One way to find out is to google: RandomForestClassifier and sklearn. This search brings us to this link.
https://scikit-learn.org/stable/modules/generated/sklearn.ensemble.RandomForestClassifier.html
From the link, you can see the list of (hyper)parameters. In this example, we will tune hyperparameter n_estimators and max_features using grid search (GridSearchCV)
import warnings
warnings.filterwarnings("ignore")


# Decide what hyperparameter to tune then decide the searching range
param_grid = {'n_estimators': range(5,15), 'max_features':range(2, 5)}

# Create a list of trees
from sklearn.model_selection import GridSearchCV
r2 = GridSearchCV(RandomForestClassifier(), param_grid, cv = 3)
r2.fit(x_train, y_train)
GridSearchCV(cv=3, estimator=RandomForestClassifier(),
param_grid={'max_features': range(2, 5),
'n_estimators': range(5, 15)})In a Jupyter environment, please rerun this cell to show the HTML representation or trust the notebook. On GitHub, the HTML representation is unable to render, please try loading this page with nbviewer.org.
GridSearchCV(cv=3, estimator=RandomForestClassifier(),
             param_grid={'max_features': range(2, 5),
'n_estimators': range(5, 15)})RandomForestClassifier()
RandomForestClassifier()
cv_result = pd.concat([pd.DataFrame(r2.cv_results_["params"]),pd.DataFrame(r2.cv_results_["mean_test_score"], columns=["Accuracy"])],axis=1)
cv_result['Rank'] = (-cv_result['Accuracy']).argsort().argsort()
cv_result| max_features | n_estimators | Accuracy | Rank | |
|---|---|---|---|---|
| 0 | 2 | 5 | 0.773659 | 24 |
| 1 | 2 | 6 | 0.789700 | 10 |
| 2 | 2 | 7 | 0.755992 | 28 |
| 3 | 2 | 8 | 0.791326 | 8 |
| 4 | 2 | 9 | 0.776864 | 22 |
| 5 | 2 | 10 | 0.772064 | 25 |
| 6 | 2 | 11 | 0.768828 | 26 |
| 7 | 2 | 12 | 0.780085 | 19 |
| 8 | 2 | 13 | 0.780062 | 20 |
| 9 | 2 | 14 | 0.802544 | 2 |
| 10 | 3 | 5 | 0.799339 | 3 |
| 11 | 3 | 6 | 0.783290 | 15 |
| 12 | 3 | 7 | 0.784916 | 12 |
| 13 | 3 | 8 | 0.794539 | 5 |
| 14 | 3 | 9 | 0.781687 | 18 |
| 15 | 3 | 10 | 0.791342 | 6 |
| 16 | 3 | 11 | 0.788113 | 11 |
| 17 | 3 | 12 | 0.791303 | 9 |
| 18 | 3 | 13 | 0.784900 | 13 |
| 19 | 3 | 14 | 0.791334 | 7 |
| 20 | 4 | 5 | 0.748026 | 29 |
| 21 | 4 | 6 | 0.776856 | 23 |
| 22 | 4 | 7 | 0.764005 | 27 |
| 23 | 4 | 8 | 0.809001 | 0 |
| 24 | 4 | 9 | 0.781703 | 16 |
| 25 | 4 | 10 | 0.797760 | 4 |
| 26 | 4 | 11 | 0.781695 | 17 |
| 27 | 4 | 12 | 0.784877 | 14 |
| 28 | 4 | 13 | 0.776880 | 21 |
| 29 | 4 | 14 | 0.804178 | 1 |
What are the best values for n_estimators and max_features?
r2.best_params_{'max_features': 4, 'n_estimators': 8}Train and test the random forest with the best parameters found above
r3 = RandomForestClassifier(**r2.best_params_)
r3.fit(x_train, y_train)
r3.score(x_test, y_test)0.8544776119402985Variable Importance
import warnings
warnings.filterwarnings('ignore')

sorted_idx = (-r3.feature_importances_).argsort()

feature_importance = pd.DataFrame({'Variables':x_train.columns[sorted_idx], 'Importance':r1.feature_importances_[sorted_idx]})
dff = feature_importance[:10]
dff.sort_values('Importance',inplace=True)

dff.plot(kind='barh',y='Importance',x='Variables', legend=False)
<Axes: ylabel='Variables'>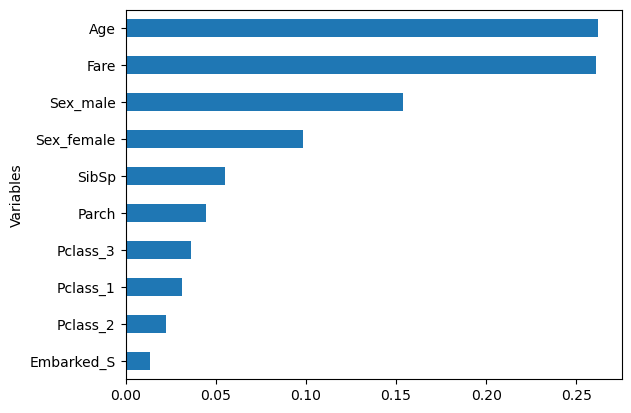
Training Errors vs. Testing Errors
We plot the accuracy of random forest when changing the number of trees. The plot shows increasing the number of trees does not necessarily overfit the data (the testing accuracy does not decrease).
n_estimators = range(2, 100)
max_features = range(2, 3)

#erros_plot = function(criterion, )

rs = pd.DataFrame(columns = ['n_estimators','max_features', 'Data','Accuracy'])

for n_estimators1 in n_estimators:
    for max_features1 in max_features:
        r1 = RandomForestClassifier(n_estimators=n_estimators1, max_features=max_features1, oob_score=True)
        r1.fit(x_train, y_train)
        new_row={'n_estimators':n_estimators1,'max_features':max_features1, 'Data':'Train','Accuracy':r1.score(x_train, y_train)}

        #rs=rs.append(new_row, ignore_index=True)

        rs = pd.concat([rs, pd.DataFrame([new_row])], ignore_index=True)

        new_row={'n_estimators':n_estimators1,'max_features':max_features1, 'Data':'Test','Accuracy':r1.score(x_test, y_test)}
        #rs=rs.append(new_row, ignore_index=True)
        rs = pd.concat([rs, pd.DataFrame([new_row])], ignore_index=True)

        new_row={'n_estimators':n_estimators1,'max_features':max_features1, 'Data':'OOB','Accuracy':r1.oob_score_}
        #rs=rs.append(new_row, ignore_index=True)
        rs = pd.concat([rs, pd.DataFrame([new_row])], ignore_index=True)


import seaborn as sns
import matplotlib.pyplot as plt
sns.lineplot(data=rs, y="Accuracy", x="n_estimators", hue='Data', ci=None)
<Axes: xlabel='n_estimators', ylabel='Accuracy'>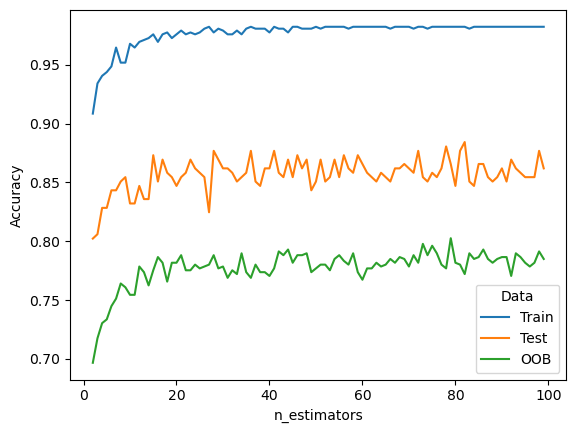
2. Practice
Following the sample codes above to do/answer the below.
- Import the breast cancer dataset. The data can be downloaded at this link
- Check out the missing values in each columns
- Set the input (X) and output (y). Split the data into 70% training and 30% testing
- Train a random forest of 100 trees. Consider 3 variables at each split. What is the training accuracy and testing accuracy of the forest?
- Consider a collection of random forest where the number of trees run from 20 to 200 and the variable considered at each split runs from 3 to 10. What is the best random forest in this collection in term of test accuracy?
- Train a random forest using the best hyperparameters found above then calculate the testing error of this tree.