class: center, middle, inverse, title-slide .title[ # Some aspects of ggplot2 - Titanic Version ] --- class: inverse, middle, center class: inverse, middle, center # Combine multiple graphs with the same aes --- ```r library(tidyverse) library(knitr) library(ggplot2) df <- read_csv('../data/titanic.csv') df <- df %>% mutate(Survived = as.character(Survived), Pclass = as.character(Pclass)) ``` --- ```r df %>% ggplot()+ geom_point(mapping=aes(x=Age, y=Fare)) ``` <!-- --> --- ```r df %>% ggplot()+ geom_point(mapping=aes(x=Age, y=Fare))+ geom_smooth(mapping=aes(x=Age, y=Fare)) ``` <!-- --> --- class: inverse, middle, center # Facets --- ```r df %>% ggplot()+ geom_point(mapping=aes(x=Age, y=Fare))+ facet_wrap(~Pclass) ``` <!-- --> --- ```r df %>% ggplot()+ geom_point(mapping=aes(x=Age, y=Fare))+ facet_wrap(~Pclass+Sex) ``` <!-- --> --- class: inverse, middle, center # Position adjustments --- ```r df %>% ggplot()+ geom_bar(mapping=aes(x=Sex, fill=Survived), position = 'dodge') ``` <!-- --> --- ```r df %>% ggplot()+ geom_bar(mapping=aes(x=Sex, fill=Survived), position = 'fill') ``` <!-- --> --- class: inverse, middle, center # geom_bar vs. geom_col --- **geom_bar for one categorical variable** ```r df %>% ggplot()+ geom_bar(mapping=aes(x=Pclass)) ``` <!-- --> --- **geom_col for one categorical variable and one continuous variable** ```r df %>% group_by(Pclass) %>% summarise(average_age=mean(Age, na.rm=TRUE)) %>% ggplot()+ geom_col(mapping=aes(x=Pclass, y=average_age)) ``` <!-- --> --- class: inverse, middle, center # Labels/Title --- ```r df %>% group_by(Pclass, Sex) %>% summarise(average_age=mean(Age, na.rm=TRUE)) %>% ggplot()+ geom_col(mapping=aes(x=Pclass, y=average_age, fill=Sex), position = 'dodge')+ labs(x='Class in the Titanic', y = 'Average Age', fill='Gender', title = 'Average Age of Passenger by Class and Gender', caption = 'The higher the class, the younger the passengers.') ``` --- 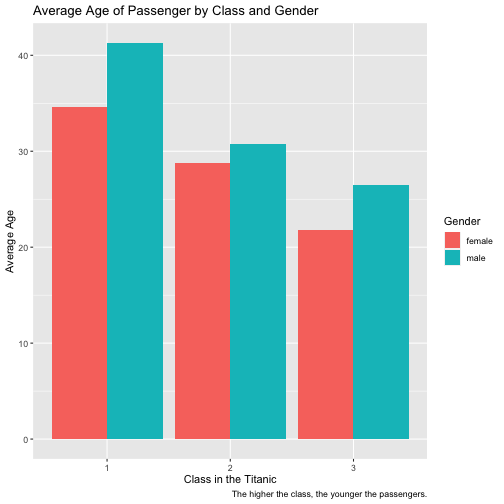<!-- --> --- class: inverse, middle, center # Change Themes --- ```r df %>% ggplot()+ geom_bar(mapping=aes(x=Sex, fill=Survived)) ``` 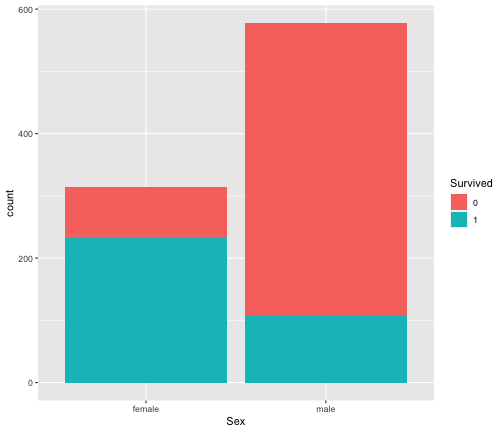<!-- --> --- ```r df %>% ggplot()+ geom_bar(mapping=aes(x=Sex, fill=Survived))+ theme_dark() ``` 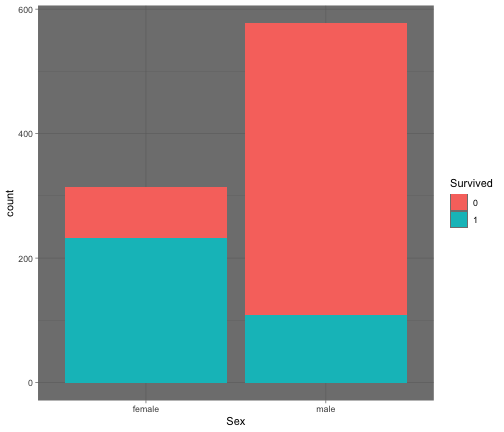<!-- --> --- ```r df %>% ggplot()+ geom_bar(mapping=aes(x=Sex, fill=Survived))+ theme_linedraw() ``` 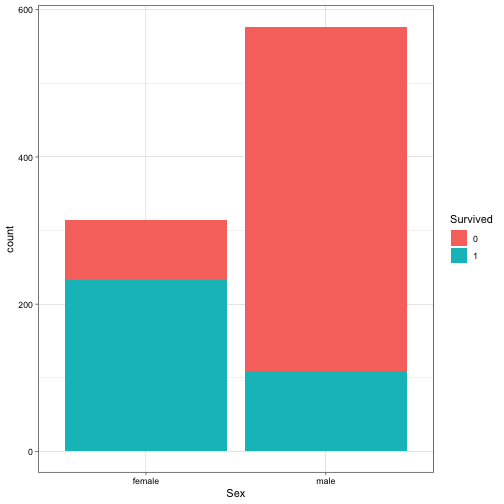<!-- --> --- # More Themes - https://ggplot2.tidyverse.org/reference/ggtheme.html --- **`ggthemes` package** ```r df %>% ggplot()+ geom_point(mapping=aes(x=Age, y=Fare, color=Survived))+ facet_wrap(~Sex) ``` 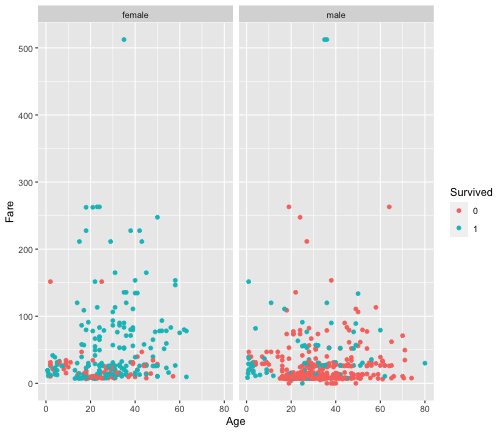<!-- --> --- **`ggthemes` package** ```r library(ggthemes) df %>% ggplot()+ geom_point(mapping=aes(x=Age, y=Fare, color=Survived))+ facet_wrap(~Sex)+ scale_color_stata() ``` 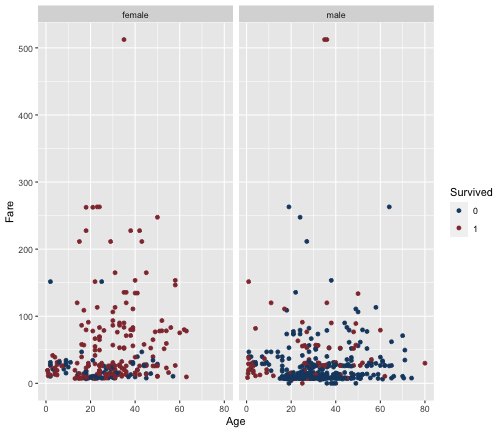<!-- --> --- **Save plots** ```r gg <- df %>% ggplot()+ geom_bar(mapping=aes(x=Sex, fill=Survived))+ theme_dark() ggsave(filename = 'abc.png', plot = gg) ``` --- class: inverse, middle, center # dplyr + ggplot --- **filter + ggplot** ```r df %>% filter(Age>=13, Age<=19) %>% ggplot()+ geom_bar(mapping=aes(x=Sex, fill=Survived)) ``` <img src="7_viz_titanic_files/figure-html/unnamed-chunk-18-1.png" height="450px" /> --- **group_by + summarise + geom_col** ```r df %>% group_by(Survived, Pclass) %>% summarise(mean_fare = Fare) %>% ggplot()+ geom_col(aes(x=Pclass, y=mean_fare, fill=Survived), position = 'dodge') ``` <img src="7_viz_titanic_files/figure-html/unnamed-chunk-19-1.png" height="400px" />